
Which Ad Is Best? What FB Data Does (And Doesn’t) Tell You
So I’ve been working on some Quizitri promotions.
Baby-steps stuff at the moment – a set of Facebook ad variants straight to sales page, to a fairly broad marketing-keen audience.
The philosophy behind this is the same as always: start simple. Yes, we’ll probably need a funnel and content and retargeting and, given the app, there’s some very sexy stuff we could do with quizzes. But it’s worth a couple of hundred bucks to find out if we don’t. Maybe we’ll save ourselves a whole lot of effort. More likely, we’ll establish a baseline so we’ve got a better idea of how much effect our future efforts have.
But that’s not really why I’m writing this.
This post is because our first set of results came in and it’s got me thinking about what you can – and more importantly, can’t – tell from the data you generate.
Because numbers are tricky bastards. They’ll make you think you’ve got a 95% significant result, but when you scale your ads the performance you see is far worse.
People make excuses for this. They’ll say things like ‘well, Facebook operates differently at scale’. “Ads have more competition when they’re being shown more often.” It could well be that’s all true – Facebook certainly rarely gives me any reason to believe their ad system wasn’t designed by a toothache-maddened honey badger – but sometimes, the clues were there to begin with, hiding in plain sight.
So, let’s talk experiments.
We tried 2 different sets of ad copy:
Ad copy 1:
Don’t just get more leads – get BETTER ones. Quizitri lets you segment your traffic into targeted lists, keeping your messaging on-point and your conversions high.
Unlimited quizzes. Client licence. One-time price available for a limited time.
Ad copy 2:
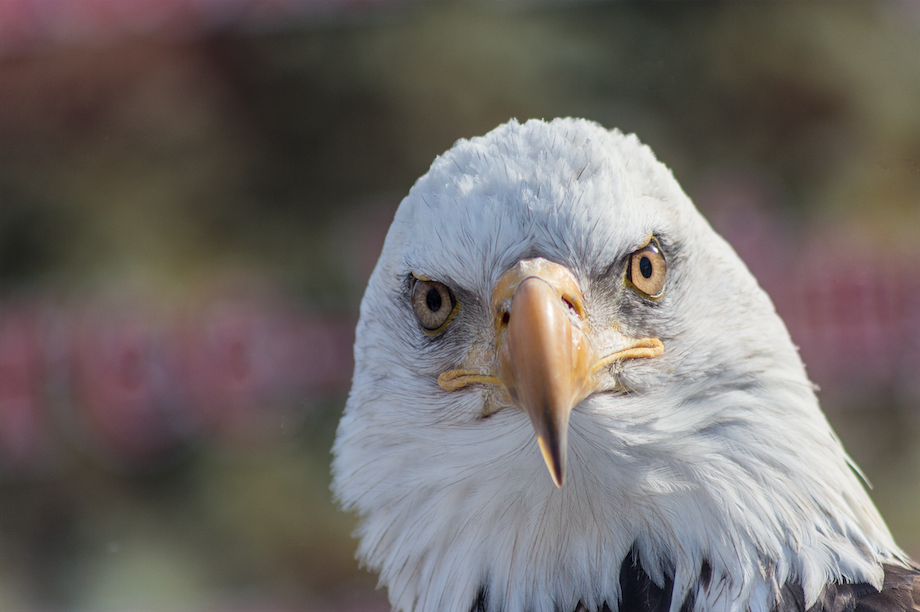
Quizzes for lead segmentation. Quizzes for more opt-ins. Quizzes to get more affiliate sales. Quizzes for your clients. And, of course, quizzes to find out what your spirit animal is. (It’s an eagle. It’s always an eagle).
Build them all and more in Quizitri. One-time price available for a limited time.
And 3 different images:
Image 1:

Image 2:

Image 3:
Which gave us six ad variants in total. We ran them all to the same broad audience for a couple of weeks, each one in its own ad set to ensure Facebook gave it a fair showing. (I’ve yet to find any better way of split-testing ads in Facebook, but if anyone’s got any ideas I would LOVE to hear them)
The results:
| Ad | Text | Image | Clicks | Reach | Imp | CTR | CPC | Freq | Spend |
| 1 | 1 | 1 | 23 | 1780 | 2416 | 1.29% | $1.47 | 1.36 | $33.73 |
| 2 | 1 | 2 | 18 | 1834 | 2372 | 0.98% | $1.90 | 1.29 | $34.21 |
| 3 | 1 | 3 | 22 | 2154 | 2693 | 1.02% | $1.55 | 1.25 | $34.13 |
| 4 | 2 | 1 | 13 | 1828 | 2697 | 0.71% | $2.63 | 1.48 | $34.15 |
| 5 | 2 | 2 | 25 | 1789 | 2318 | 1.40% | $1.36 | 1.30 | $34.01 |
| 6 | 2 | 3 | 20 | 1948 | 2320 | 1.03% | $1.69 | 1.19 | $33.89 |
At first glance, we’ve got a clear winner. Ad variant 5, with ad copy 2 and image 2, had a far higher CTR than any of the others – only variant 1 really came close. And indeed, if we check the significance levels for the CTR, that first impression seems to be confirmed:
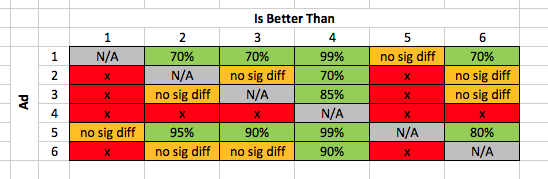
Ad variant 5 was the winner. Ad variant 1 came a respectable second. Ads 2, 3, and 6 were middling, and ad 4 sucked.
But if we dive a bit deeper into the data, we can draw some very different conclusions.
We can also use this data set to look at which text variant and which image did best overall – arguably, more accurately, as there’s more data to draw on. Combining the results for all the ads that use the different copy variants gives us this:
| Text | Clicks | Reach | Imp | CTR | CPC | Freq | Spend |
| 1 | 63 | 5768 | 7481 | 1.09% | $1.62 | 1.30 | $102.07 |
| 2 | 58 | 5565 | 7335 | 1.04% | $1.76 | 1.32 | $102.05 |
With no significant difference between the performance of each bit of copy. Neither of them did better overall than the other
Hm.
Let’s do this again for the images:
| Image | Clicks | Reach | Imp | CTR | CPC | Freq | Spend |
| 1 | 36 | 3608 | 5113 | 1.00% | $1.89 | 1.42 | $67.88 |
| 2 | 43 | 3623 | 4690 | 1.19% | $1.59 | 1.29 | $68.22 |
| 3 | 42 | 4102 | 5013 | 1.02% | $1.62 | 1.22 | $68.02 |
Here, there is a small result. Image 2 – the woman holding the phone – did perform better than the other 2 at a very low level of significance: 75% against image 1, and 70% against image 3.
(Which means if we scaled everything as much as we could, we’d expect to see image 2 outperform image 1 three times out of 4, and outperform image 3 seven times out of ten. For comparison, 95% is the generally accepted standard to look for)
This is broadly in line with what we’d expect to see. Images of people do tend to outperform other images pretty consistently. But still – it wasn’t by a big margin. And while our best-performing ad did use Image 2, so did our second-worst performer.
And this is something worth considering in your data set. Is there consistency?
Here, the first set of ad copy was part of our best perfoming ad. But it was also part of the worst. Image 2 did feature in our best performer, but of all the ads using the second set of ad copy, the one using Image 2 performed worst.
There’s no component we can point to that says ‘ads using this did better’. The results are all over the shop.
And maybe it was the specific combination of that text and image, making an ad that had a far bigger effect than either of its individual components.
But honestly? Probably not.
More likely is that one of the ads just did better by chance. Yes, ad 4 produced some good, significant results, but one set of numbers is always going to be highest. That’s how numbers work.
And the more ads you’re testing, the more likely you are to see – completely randomly – a significant result.
Our next-best performer was Ad 1 (which didn’t use any of the same components as Ad 4). The odds that Ad 4 would beat Ad 1 to the degree that it did, entirely by chance, are 30%. The odds that at least one of the other 5 ads we tested would beat it to that degree, entirely by chance, are 83%.
That doesn’t mean there’s nothing we can tell from this data.
We can be pretty certain none of the ads are relatively terrible performers – at worst, they’re all broadly similar.
We can be pretty certain that the copy variations made no difference to the effectiveness of the ads.
And if we could find more consistency in the overall performance of text or image variants, we could be more confident about seeing equivalent results at scale. But we can’t, so we’re not.
I’m still going to throw more money at Ad 4 and test it against some fresh variants. But I’m not going to be entirely surprised if the current results don’t keep up.